Overview
The Hospice Timing section of the Utilization & Quality tab gives you a data-driven view of how the timing of hospice enrollment affects Medicare costs and healthcare utilization for patients treated by the selected facility. Patients are grouped by the number of days they were enrolled in hospice before their death — from no hospice at all to 121 or more days — making it easy to see how cost and utilization patterns shift when patients enter hospice earlier or later in their care journey.
This section replaces the previous Hospice Timing - Last 30 Days of Life panel with two enhanced panels:
- Hospice Timing – Medicare Cost of Care Impact — the average total Medicare cost per patient broken down by care setting (Inpatient, ER/OBS, Outpatient, SNF, Home Health, Hospice, Professional, and DME), with comparisons to state and national benchmarks
- Hospice Timing – Utilization Impact — inpatient visit rates, ER visit rates, ER-to-inpatient visit rates, and observation visit rates per 1,000 patients, with state comparisons
Both panels are available on the Analyze page for both hospital and physician facilities.
Location
The Hospice Timing panels are found under the Utilization & Quality tab of the Analyze page for a selected facility.

Both the Medicare Cost of Care Impact and Utilization Impact panels appear in this section. |
 |
 In this article
| Hospice Timing – Medicare Cost of Care Impact — a visual analysis showing how earlier and longer hospice enrollment correlates with lower overall Medicare spend, broken down by care setting, with state and national benchmarks |  |
|
| Hospice Timing – Utilization Impact — for patients treated by the selected facility, shows inpatient, ER, ER-to-inpatient, and observation visit rates per 1,000 patients across each hospice timing group | ||
Quick Value
 See the Full Cost Picture
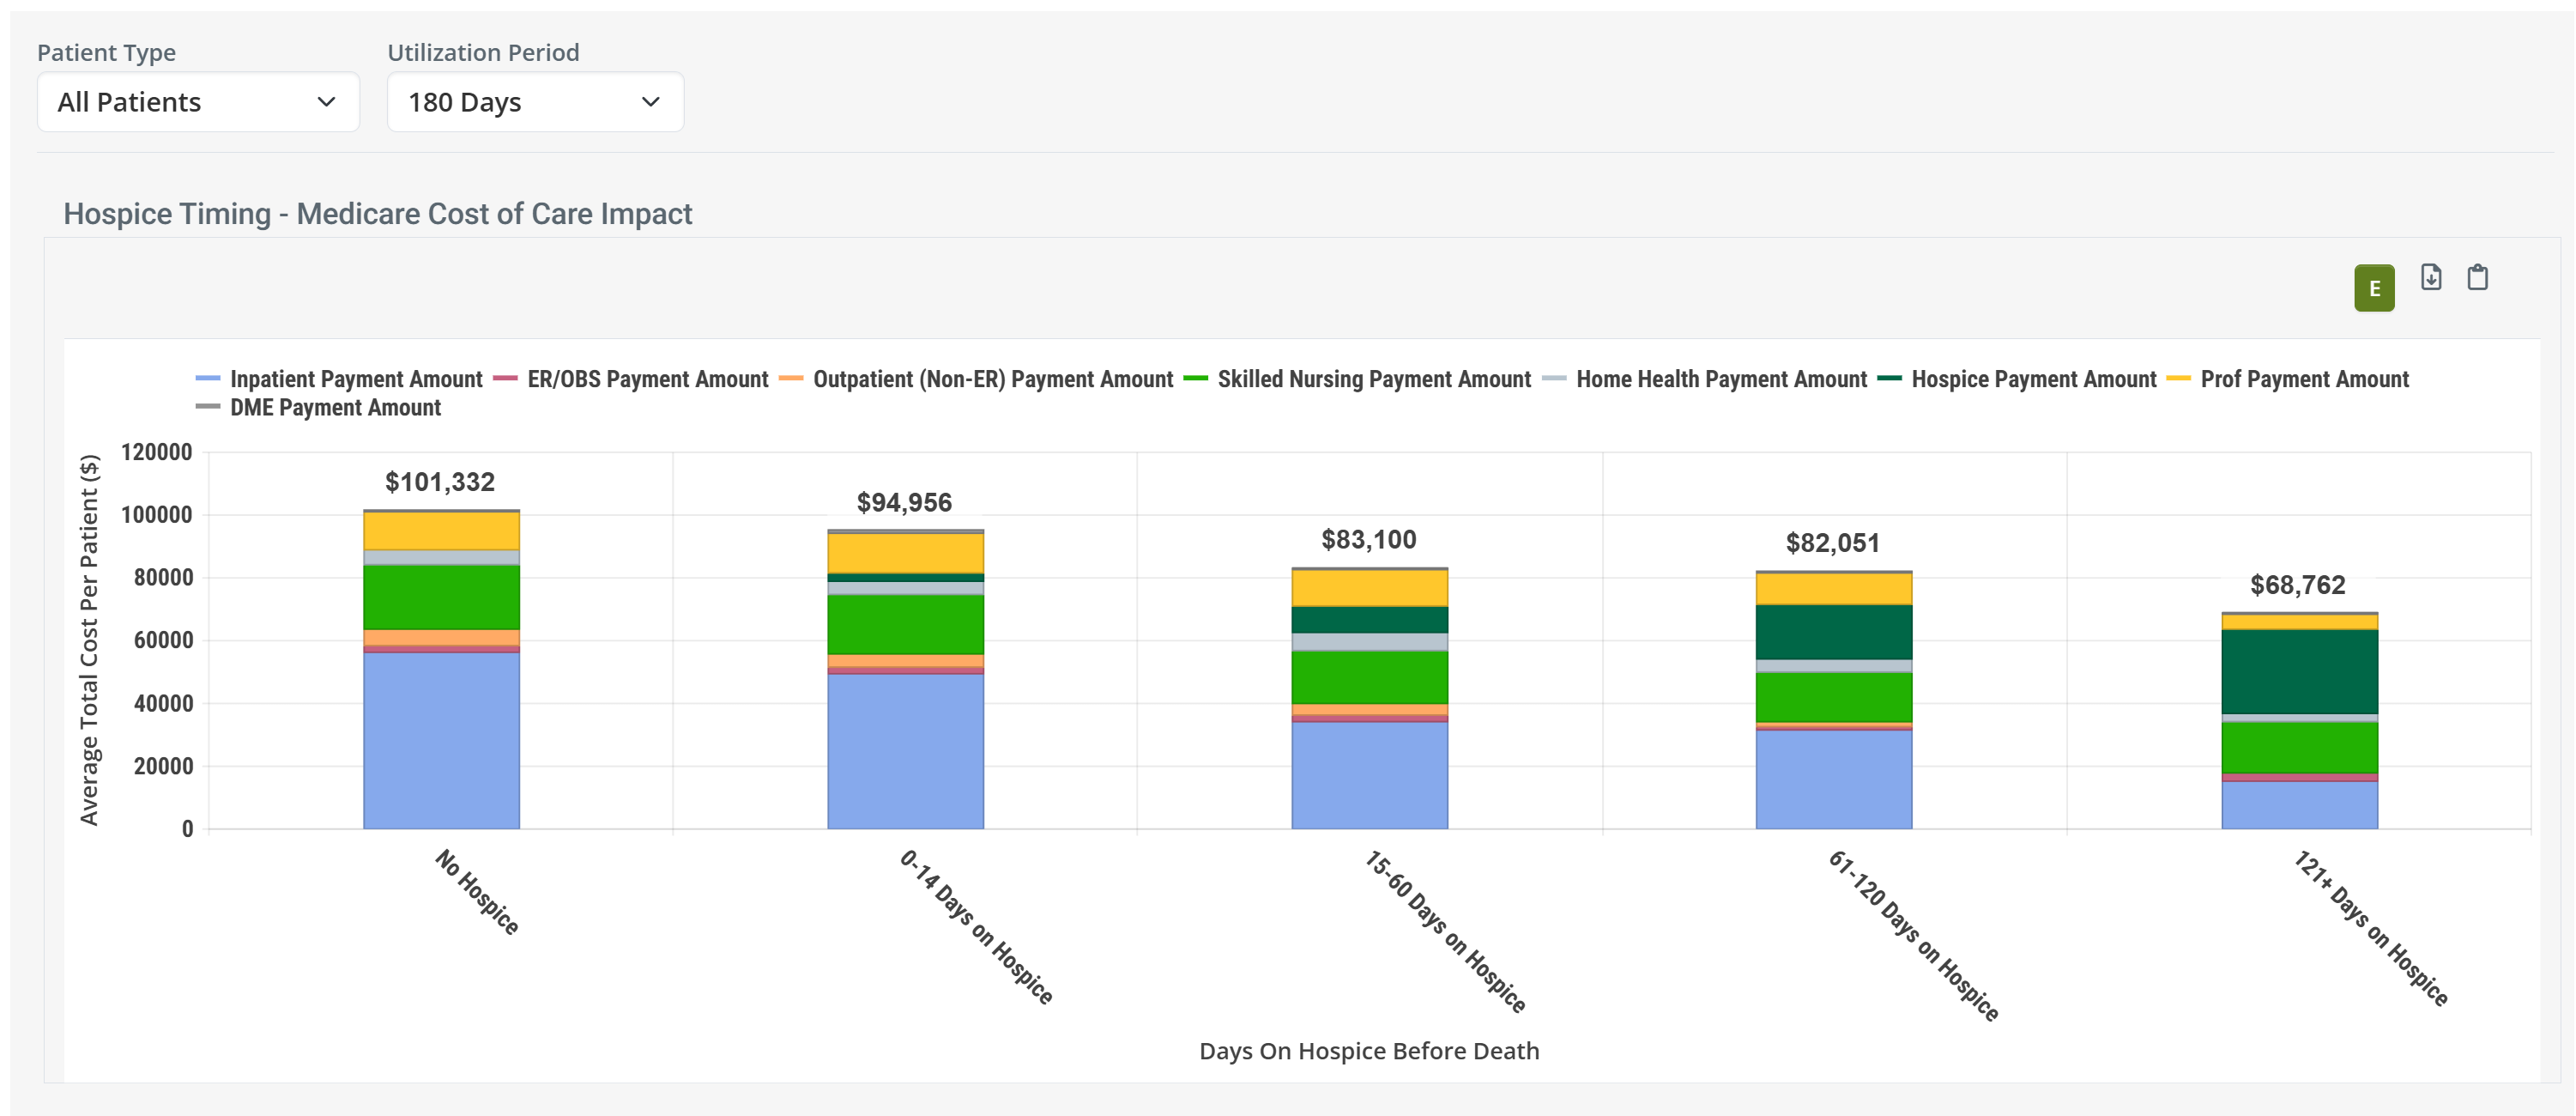
The Medicare Cost of Care Impact panel breaks down average total Medicare cost per patient into eight care settings — Inpatient, ER/OBS, Outpatient (Non-ER), Skilled Nursing, Home Health, Hospice, Professional, and DME. By viewing costs across five hospice timing groups side by side, you can see exactly where Medicare dollars are being spent, and how that spending changes when patients enter hospice earlier.
 Identify and Act on Opportunities
State and national benchmarks are included for every cost category and every hospice timing group. When your facility's numbers stand apart from those benchmarks, that's a signal — either a strength to highlight in your conversations or a gap worth addressing. Use the Patient Type filter to drill into specific acuity levels or chronic conditions and discover where the improvement opportunity is greatest.
 Drive Earlier Hospice Referrals
This data is a powerful conversation starter. When you can show a referral partner how average total Medicare costs decline — and how ER and inpatient utilization drops — as patients are enrolled in hospice earlier, you turn a data point into a compelling clinical and financial argument. Use this panel to support outreach conversations with hospitals, physicians, and other facilities that refer patients to your hospice.
 Grow with Intention
Not all patients are the same, and neither are all referral opportunities. Filter by patients with high acuity or by specific chronic conditions such as cardiac, neurologic, or oncologic diagnoses to focus your analysis on the populations where earlier hospice enrollment has the most measurable impact. Bring those targeted insights into your referral partner meetings to make every conversation count.
Filters & Features
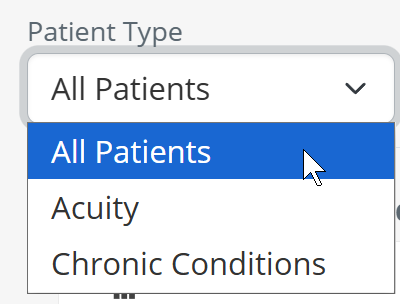
Patient Type
The Patient Type filter lets you narrow the analysis to a specific group of patients treated by the selected facility. Your selection applies to both Hospice Timing panels simultaneously.
Both panels update immediately to reflect your selection. |
 |
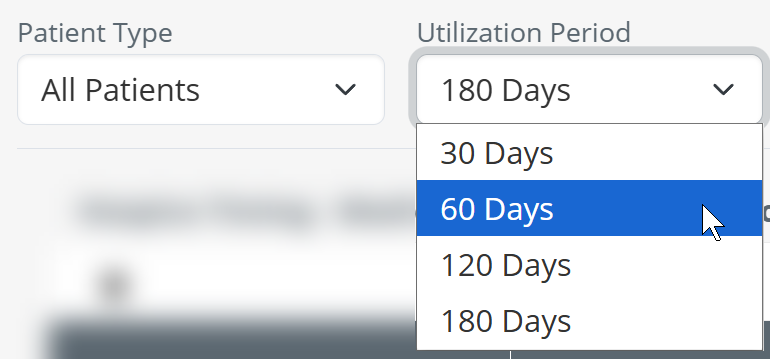
Lookback Period Before Death
The Lookback Period Before Death filter controls which patients are included based on how recently the facility treated them before their death. A shorter lookback period focuses on patients whose last encounter was in the final weeks before death; a longer period captures a broader patient population with more patients in each hospice timing group.
|
 |
|
 |
The diagram below illustrates how the lookback period works. Patients are included when their last discharge from the facility occurred within the selected number of days before their date of death.
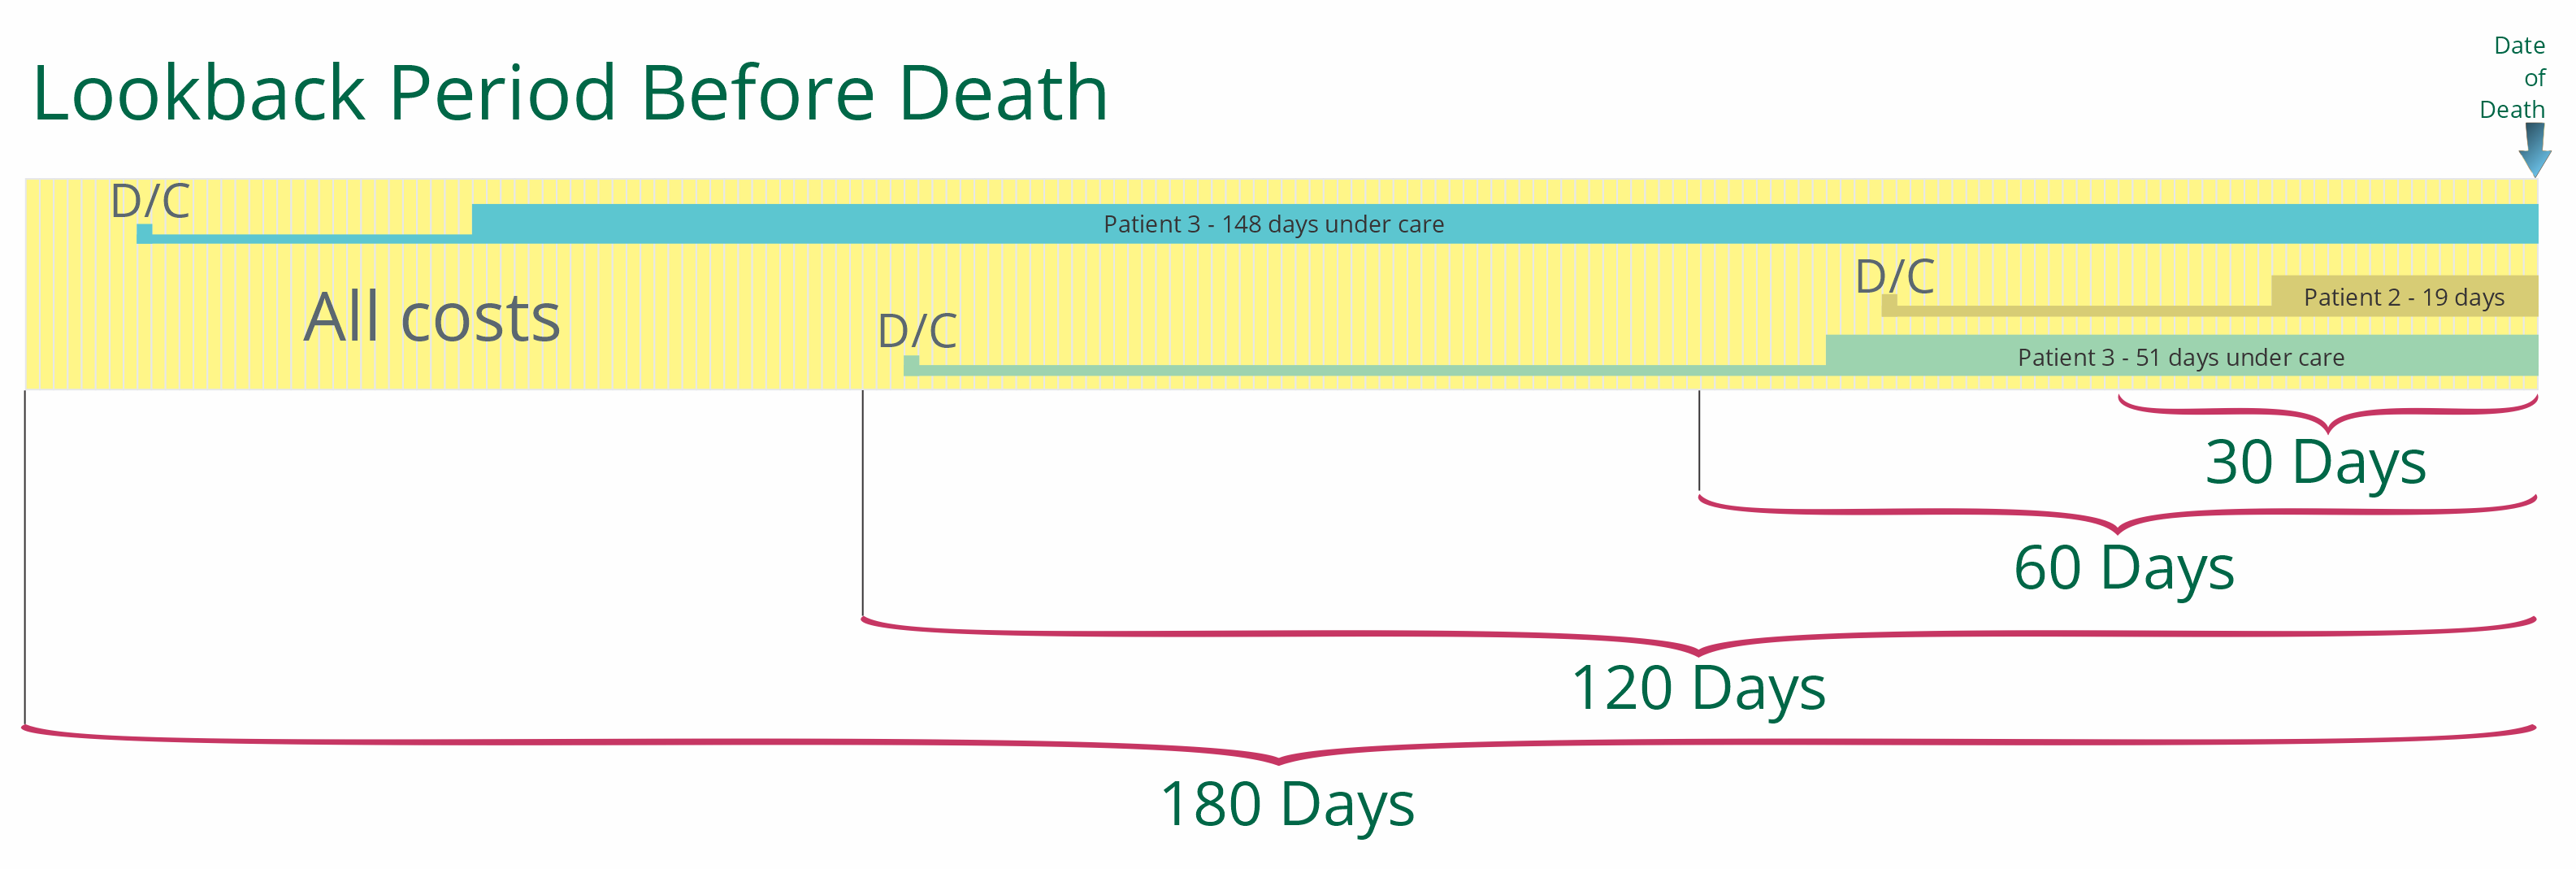
Chart View
The Chart View toggle in the upper left of the Medicare Cost of Care Impact panel switches the display between a stacked bar chart and a data table. The Utilization Impact panel always displays as a table regardless of this setting.
Chart View On |
Chart View Off |
|
 |
| With Chart View On, the Medicare Cost of Care Impact panel displays a stacked bar chart. Each bar represents a hospice timing group. The colored segments show each care setting's contribution to the total average Medicare cost per patient. | With Chart View Off, the panel displays a data table with This Facility, State, and National columns for each care setting. |
Legend
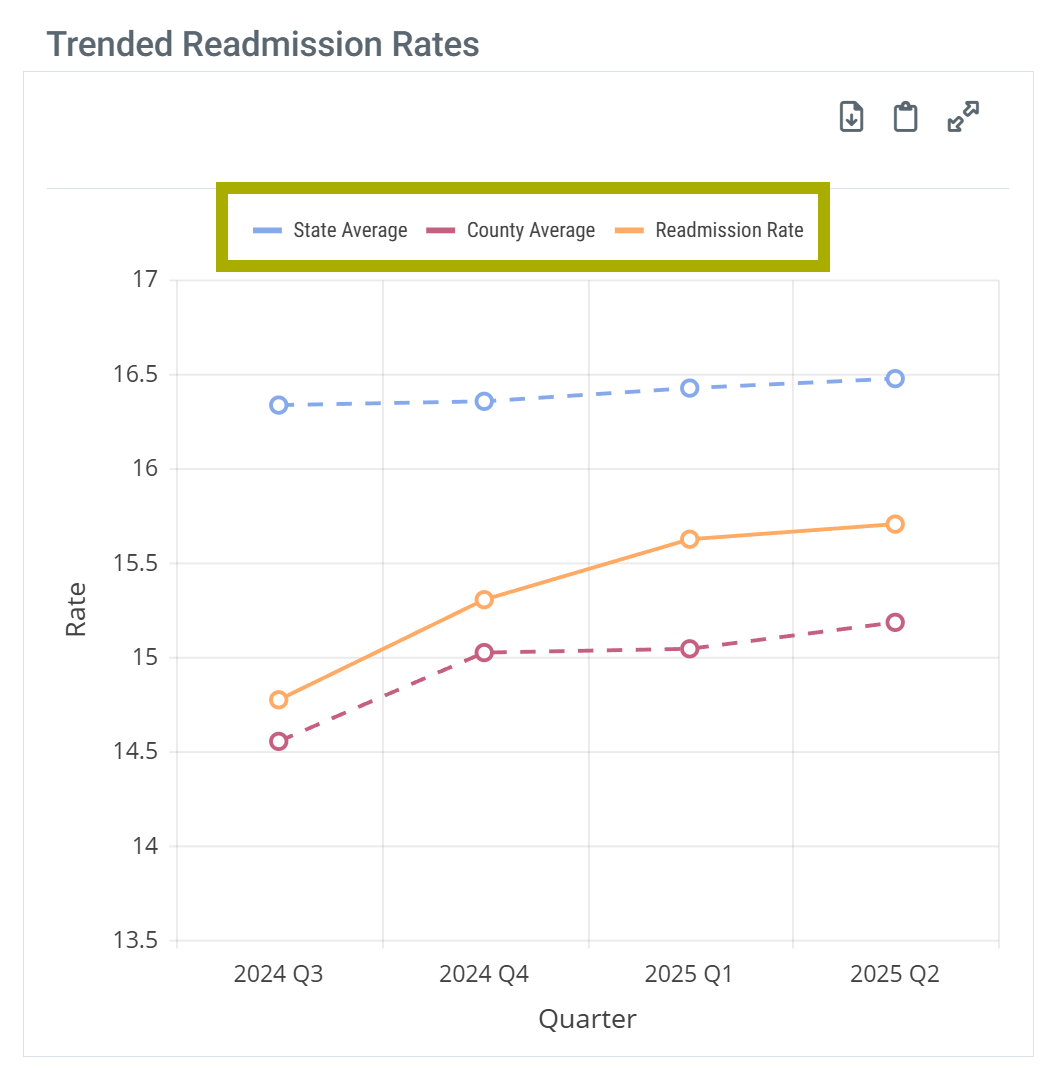
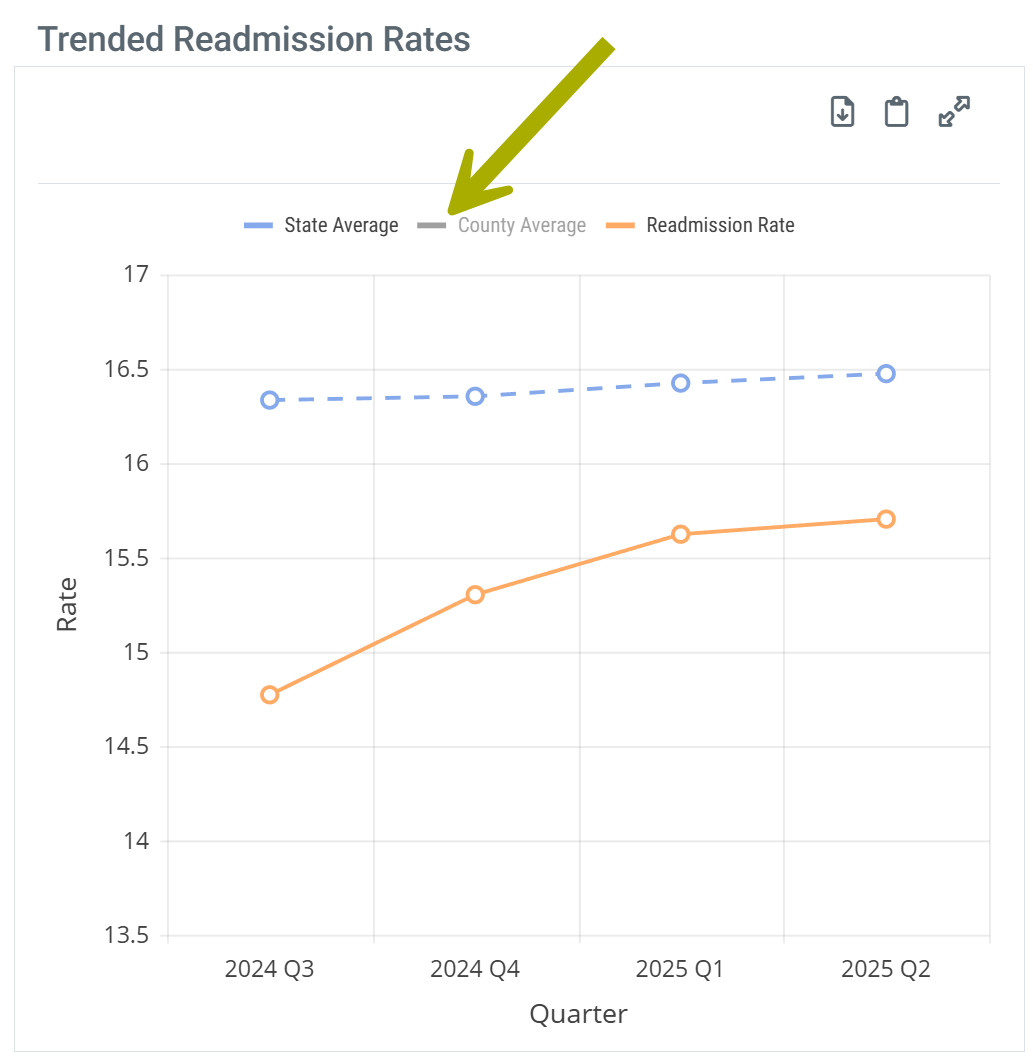
When Chart View is on, the Medicare Cost of Care Impact chart displays a legend identifying the eight care setting cost categories. You can click any legend item to show or hide that category in the chart.
| Legend Expanded | Legend Collapsed |
 |
 |
|
| |
Hospice Timing – Medicare Cost of Care Impact
This panel shows the average total Medicare cost per patient for patients treated at the selected facility, grouped by how many days they were enrolled in hospice before their death. Patients are included based on your selected Lookback Period Before Death. Costs are shown in aggregate and broken down into eight care settings so you can see where Medicare dollars are being spent — and how that spending changes when patients receive hospice care earlier.
The five hospice timing groups are:
- No Hospice — patients who were never enrolled in hospice
- 0–14 Days on Hospice — enrolled for two weeks or less before death
- 15–60 Days on Hospice
- 61–120 Days on Hospice
- 121+ Days on Hospice — enrolled for four months or more before death
Data Presentation
|
Off
|
 |
|
On
|
 |
|
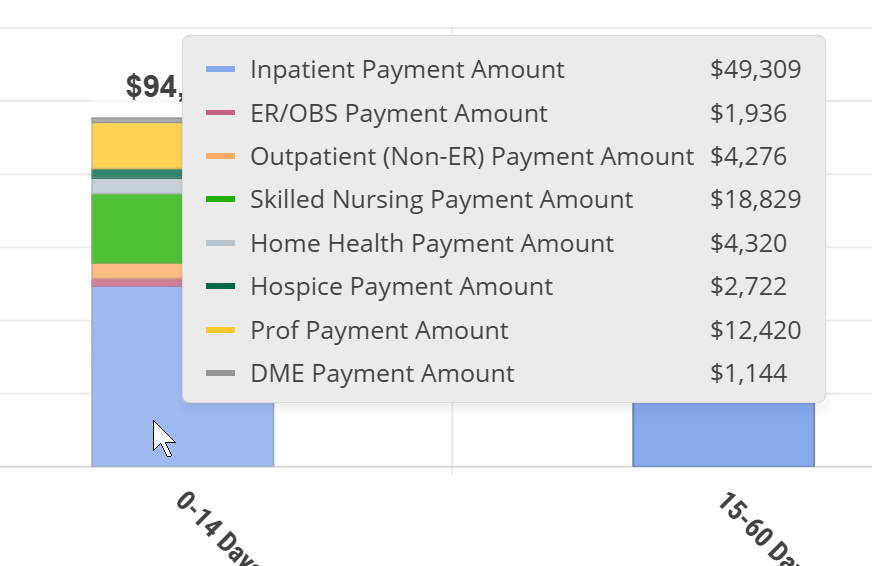
When you hover over a bar in the chart, a tooltip displays the exact dollar amount for each care setting within that hospice timing group.
|
![]() To enlarge an image, click on it.
To enlarge an image, click on it.
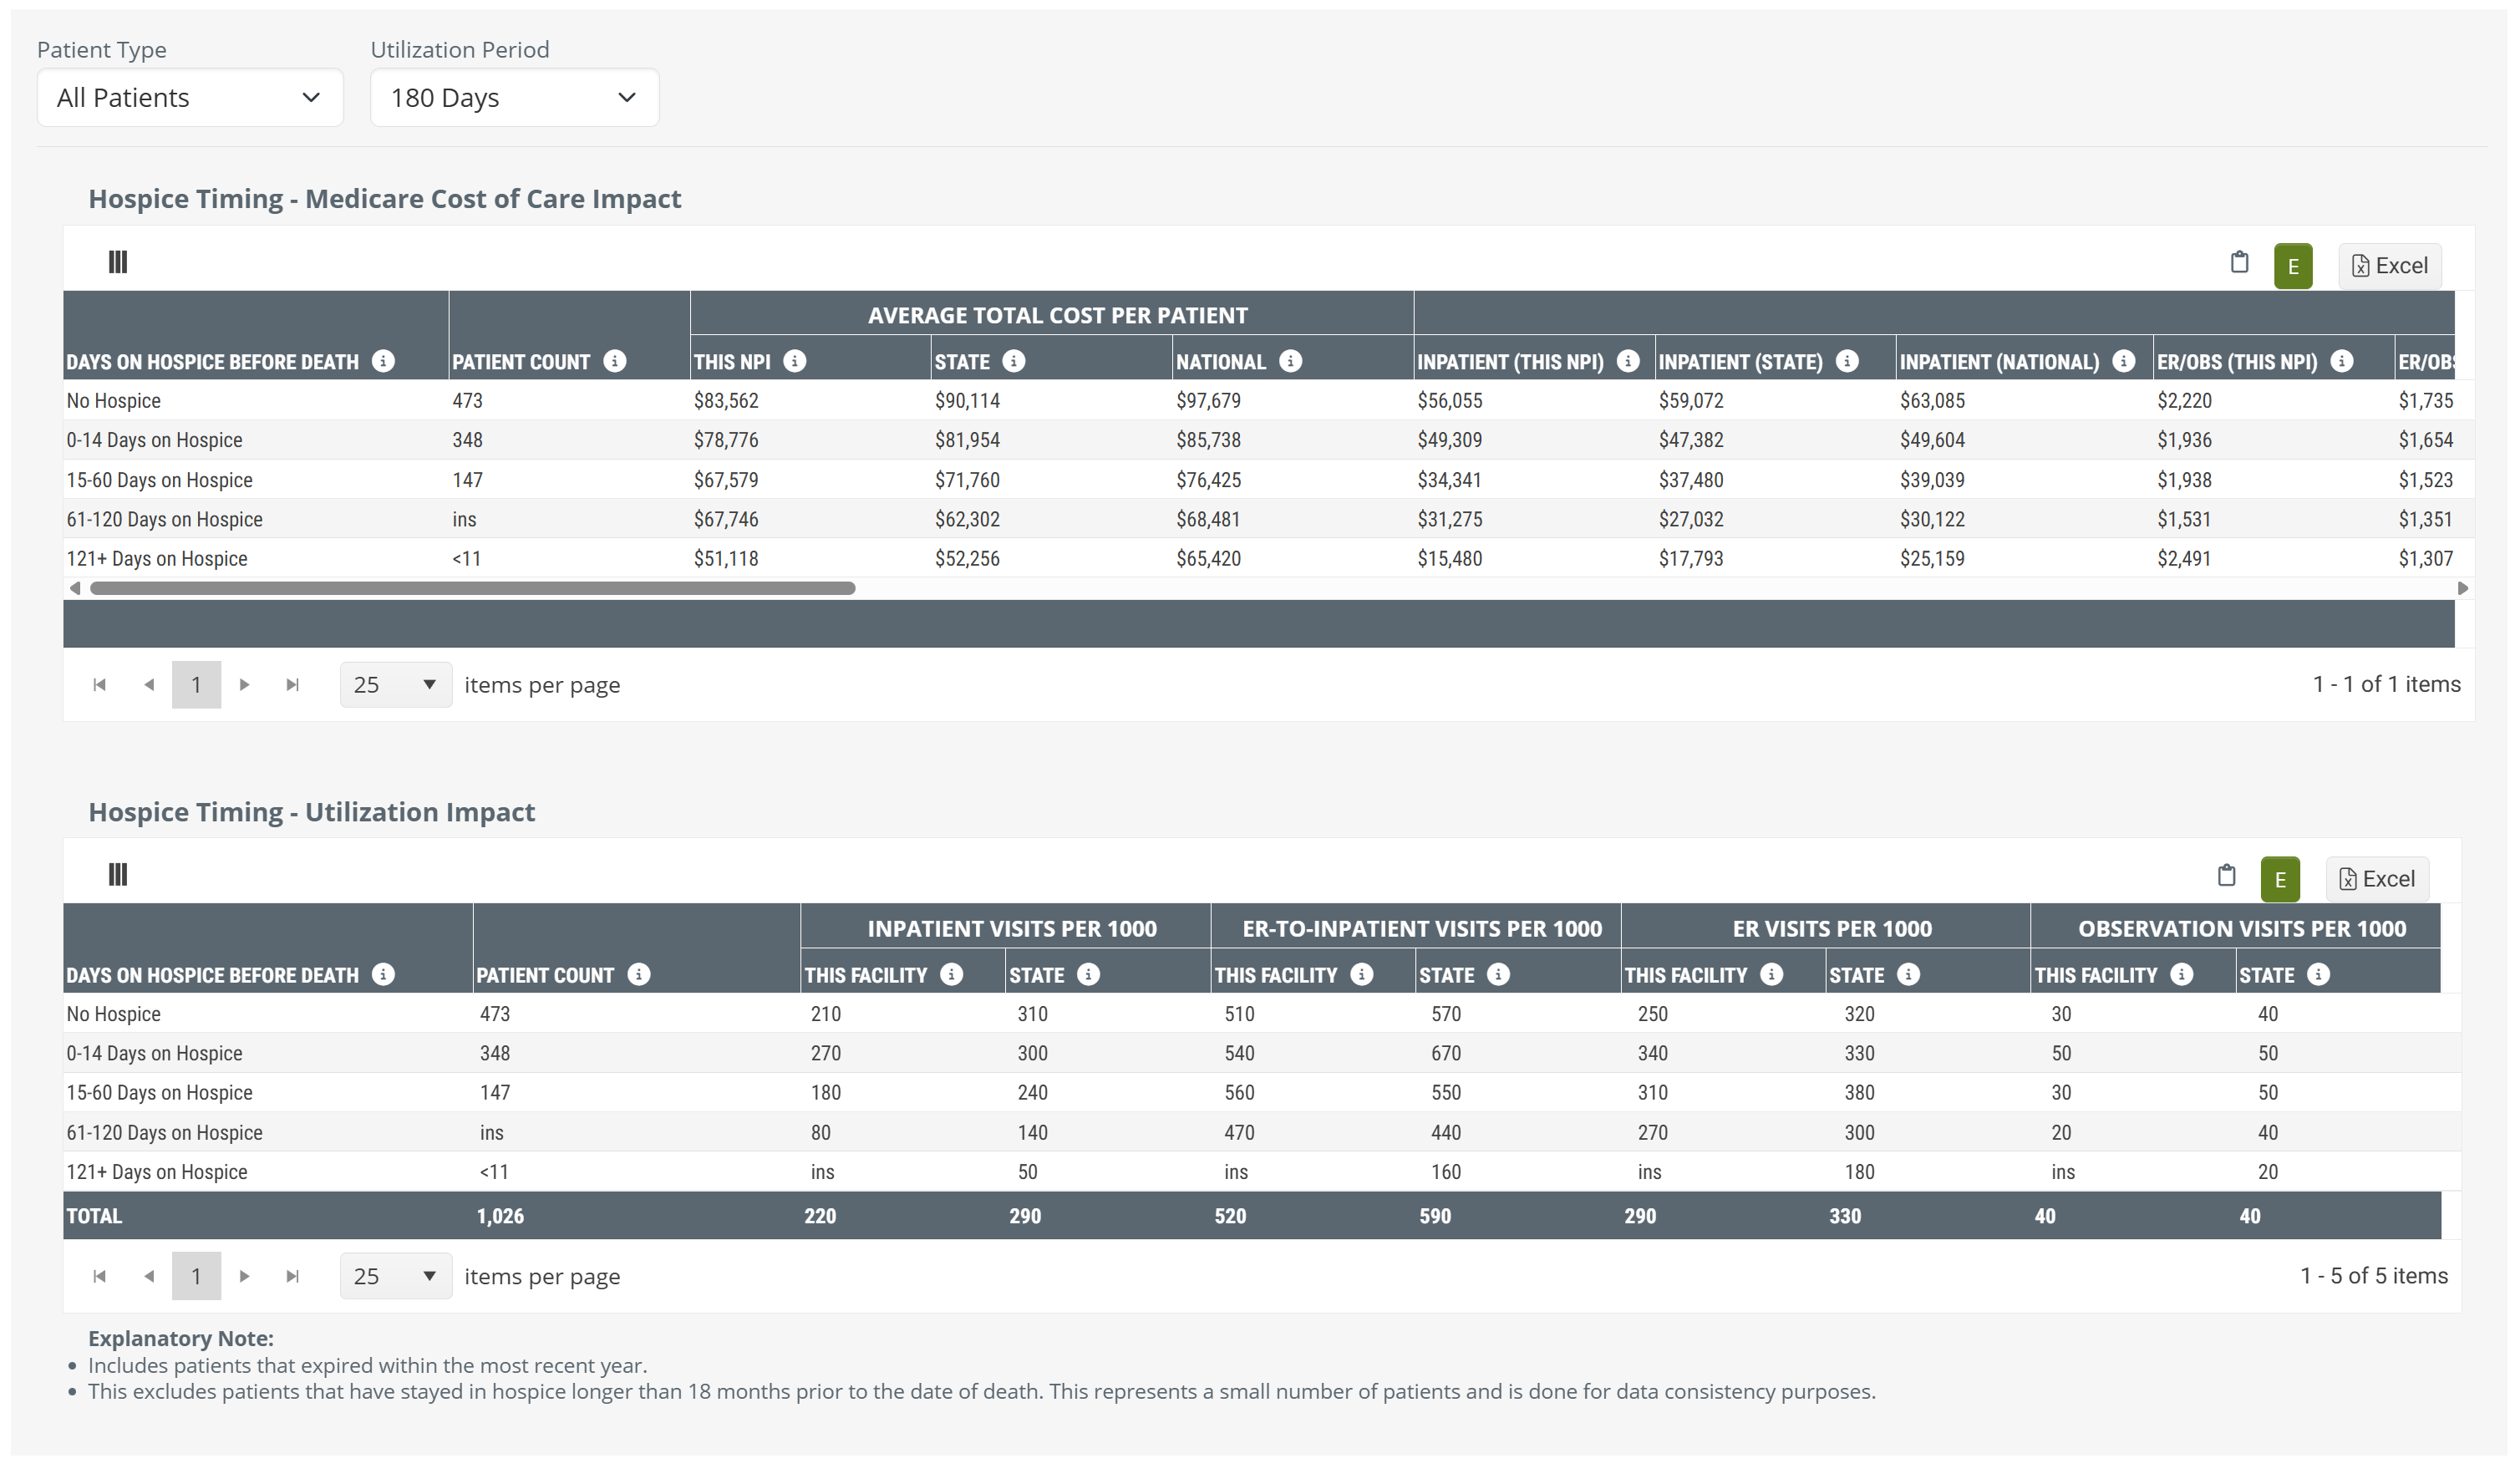
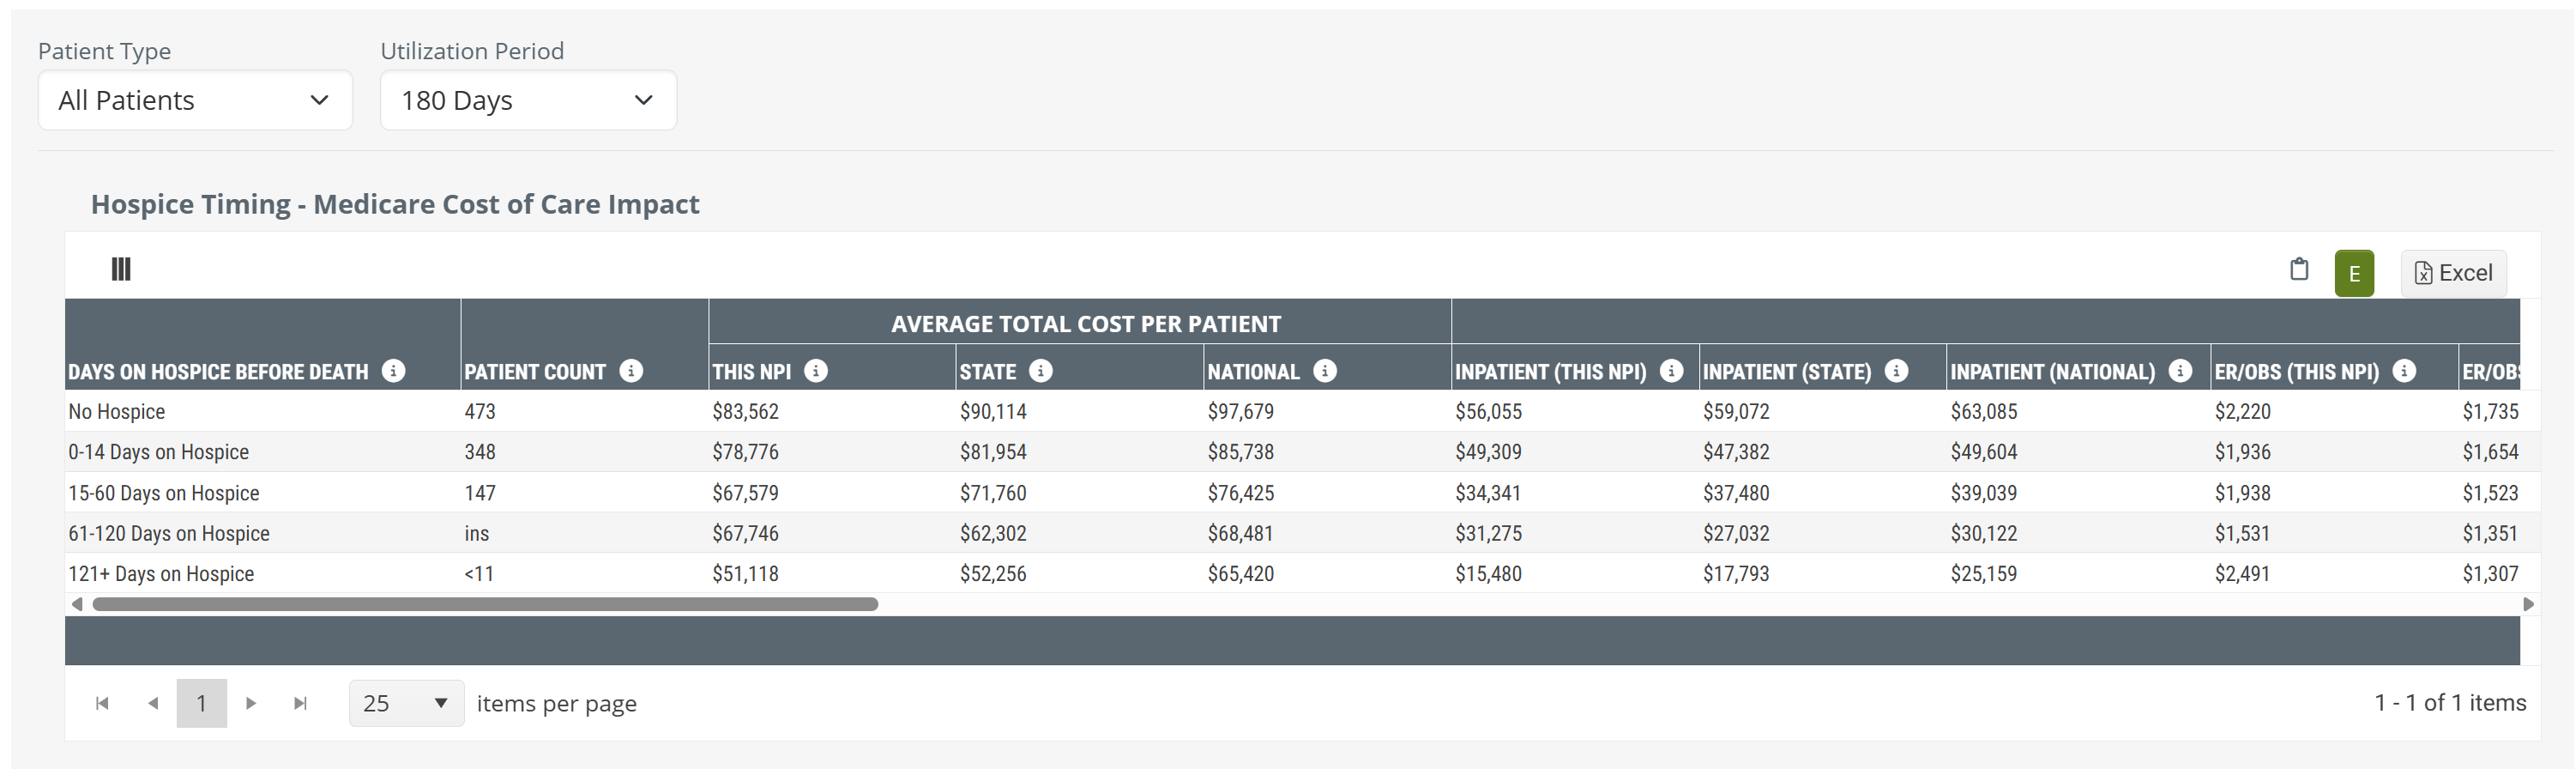
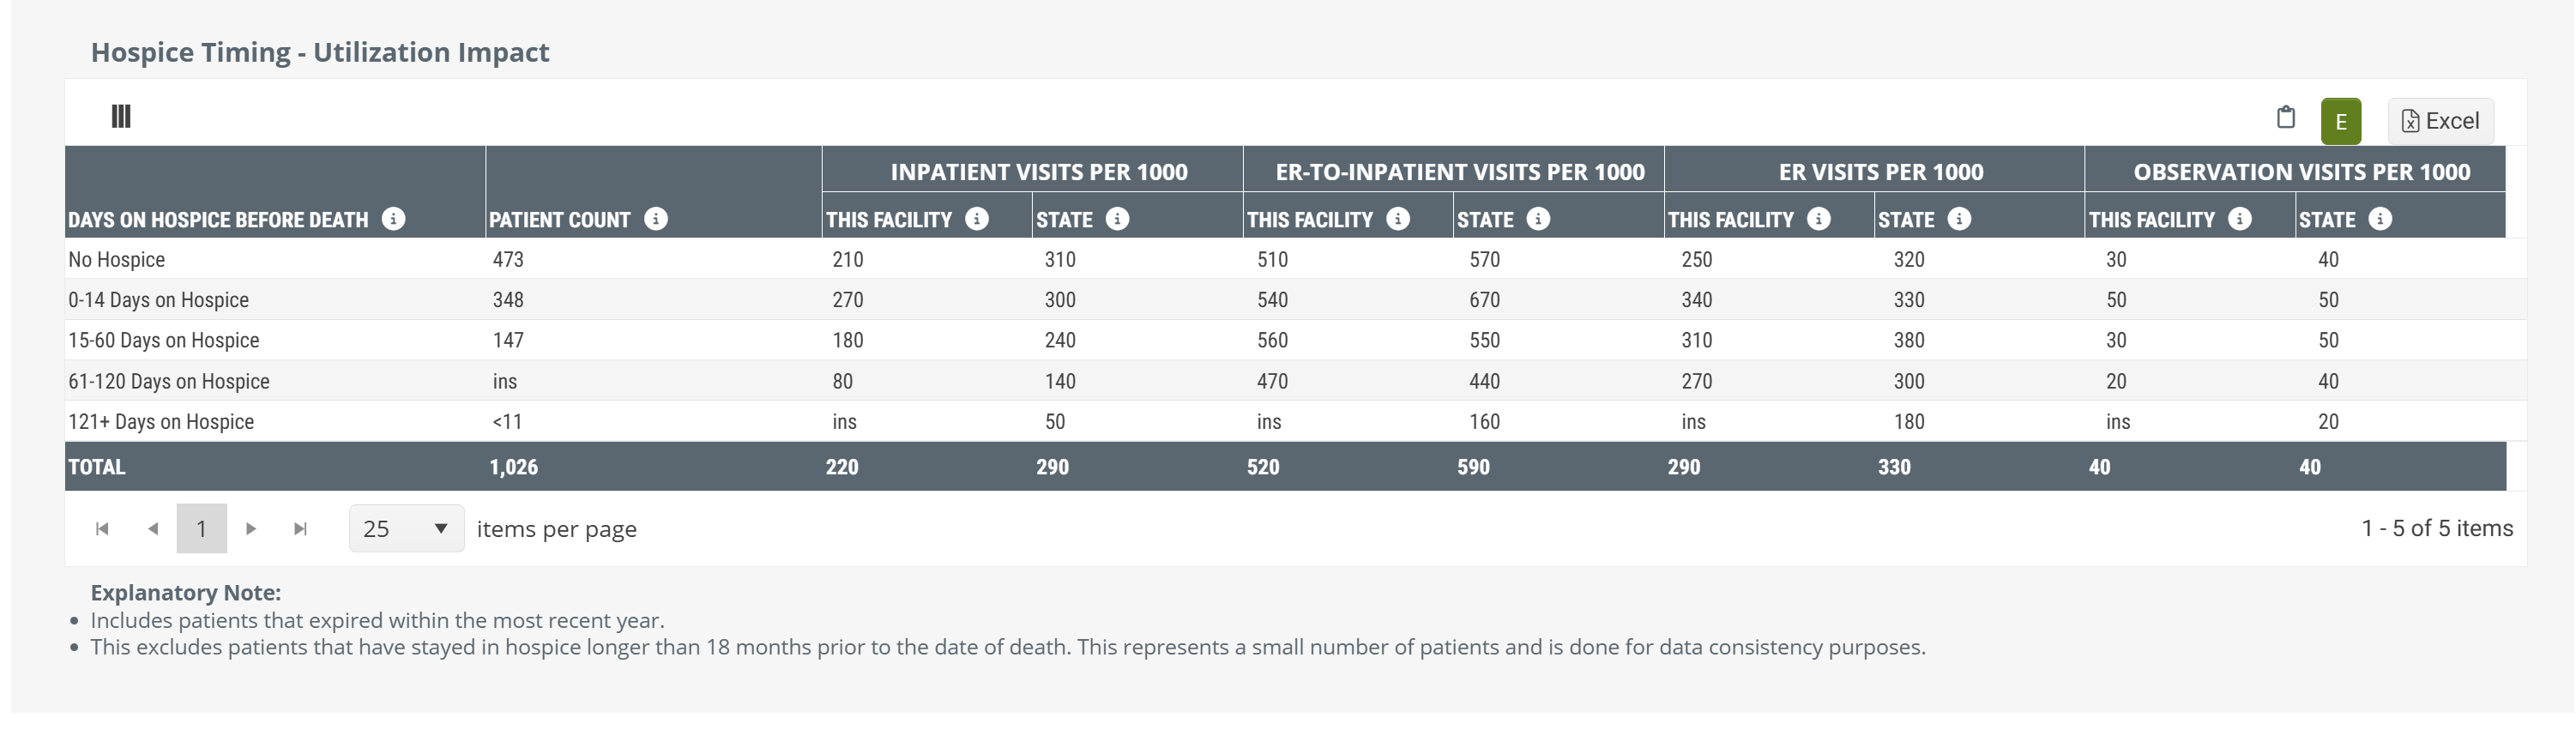
Because the full table spans eight care setting columns — each with This Facility, State, and National values — it may extend beyond the visible screen width. Scroll horizontally within the panel to see all columns. The image below shows the complete table layout.

![]() Rows labeled ins indicate a patient count too small for reporting (suppressed for privacy). Rows showing <11 as the patient count have fewer than 11 patients in that group.
Rows labeled ins indicate a patient count too small for reporting (suppressed for privacy). Rows showing <11 as the patient count have fewer than 11 patients in that group.
Cost Categories
The eight care setting cost categories shown in this panel are listed below. Each appears as a separate column in the table view and as a color-coded segment in the chart view.
| Inpatient | Average Medicare payment amount for inpatient hospital stays |
| ER/OBS | Average Medicare payment amount for emergency room visits and observation stays |
| Outpatient (Non-ER) | Average Medicare payment amount for outpatient services, excluding emergency room visits |
| Skilled Nursing | Average Medicare payment amount for skilled nursing facility stays |
| Home Health | Average Medicare payment amount for home health services |
| Hospice | Average Medicare payment amount for hospice services |
| Professional | Average Medicare payment amount for professional (physician) services |
| DME | Average Medicare payment amount for durable medical equipment |
Hospice Timing – Utilization Impact
The Utilization Impact panel shows acute care visit rates per 1,000 patients for each hospice timing group. As patients are enrolled in hospice earlier — and for longer — you can expect to see meaningful reductions in inpatient admissions, ER visits, and observation stays. This panel helps you quantify that relationship for the patients treated by your facility and compare it to the state average.
This panel always displays as a table regardless of the Chart View setting.
|
The table shows four utilization metrics for each hospice timing group:
Each metric is displayed for This Facility and State, so you can compare your facility's utilization rates to the state average within each hospice timing group. |
 |
Utilization Metric Definitions
| Inpatient Visits per 1,000 | The number of inpatient hospital admissions per 1,000 patients in the group during the lookback period before death |
| ER-to-Inpatient Visits per 1,000 | The number of inpatient admissions that originated from an emergency room visit, per 1,000 patients in the group |
| ER Visits per 1,000 | The total number of emergency room visits per 1,000 patients in the group, including both visits that led to an inpatient admission and those that did not |
| Observation Visits per 1,000 | The number of hospital observation stays per 1,000 patients in the group during the lookback period before death |
Data Notes
![]() Keep the following in mind when interpreting the data in this section:
Keep the following in mind when interpreting the data in this section:
- Patient population: Includes patients who expired within the most recent reporting year and whose last discharge from the facility occurred within the selected Lookback Period before their date of death.
- Hospice duration exclusion: Patients enrolled in hospice for longer than 18 months prior to their death are excluded for data consistency purposes, as these cases represent a small number of atypical patients.
- Privacy suppression: Patient groups with counts too small to report will display ins (insufficient) in the data cells. Groups with fewer than 11 patients display <11 as the patient count.
- Access: All hospice users have full access to both Hospice Timing panels. Users of SNF or HHA products have access to the Inpatient MS-DRG breakdown only.